

Seasonality studies show that in any decade, years ending with a 5 have tended to be favorable for stocks
- The last two Year 5’s have been somewhat subpar
- Year 5 is also part of a broader “mid-decade bulge“
Lets test this theory:
For testing Year 5 stock market performance, we will use month-end price data for:
- The Dow Jones Industrial Average from 1901 through 1919
- The S&P 500 Index from 1920 to the present day
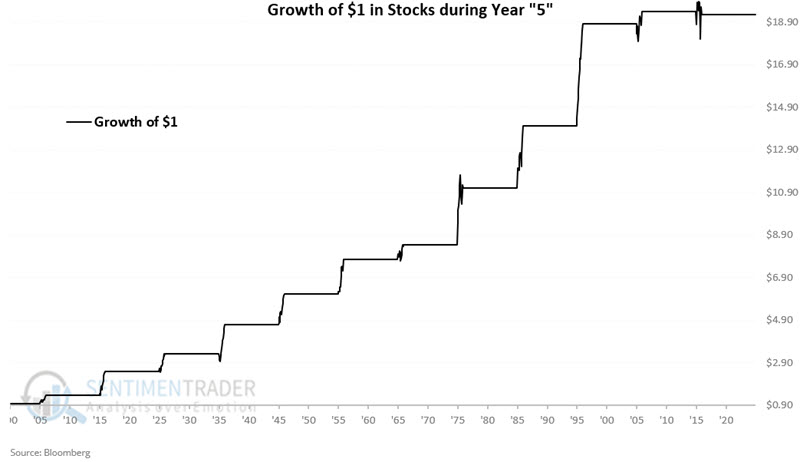
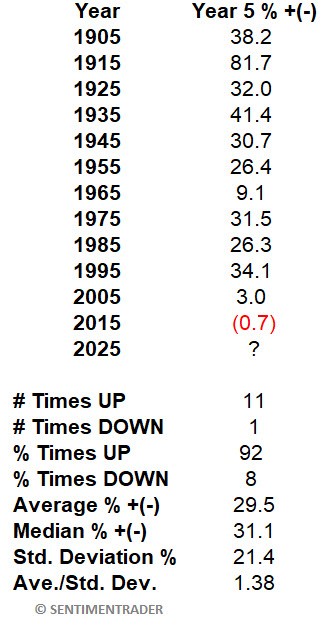
Year 5 occurs every ten years starting in 1905 (1905, 1915, 1925, 1935, etc.). Year 5 showed a gain for eleven straight decades before the S&P 500 registered a minor -0.7% price decline in 2015. That followed a relatively subpar +3.0% performance in 2005.
So, is there really any reason to care that 2025 ends with a “5?”
A closer look at Year 5 performance
The chart below displays the hypothetical growth of $1 in stocks (as defined above) using month-end price data only during Years 5 since 1905.
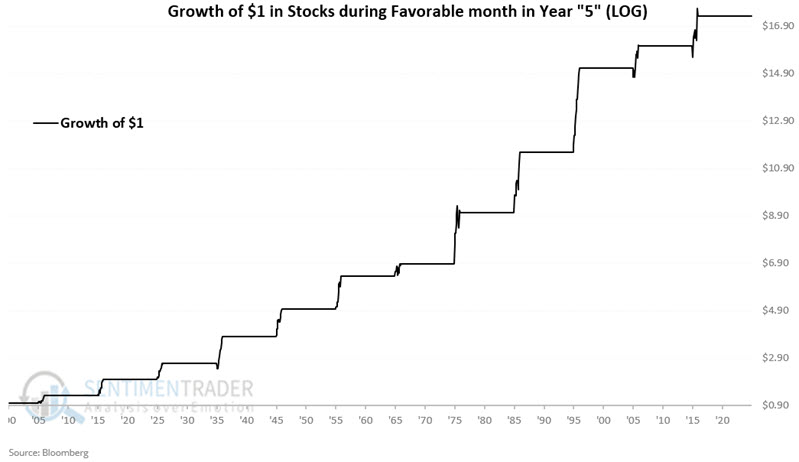
The chart below displays the same results on a logarithmic scale.
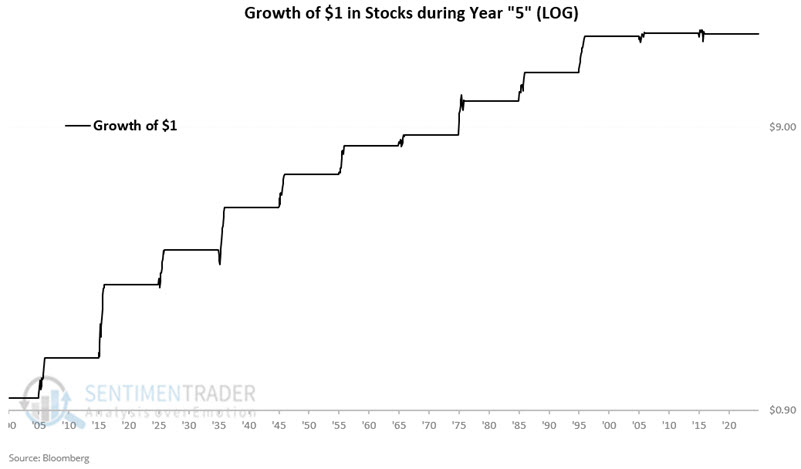
The lackluster performance during 2005 and 2015 is more evident in the log chart.
The table below displays annual price performance for Years 5 (using the Dow in 1905 and 1915 and the S&P 500 after that) and a summary of yearly results.
A closer look at Year 5 results month-by-month
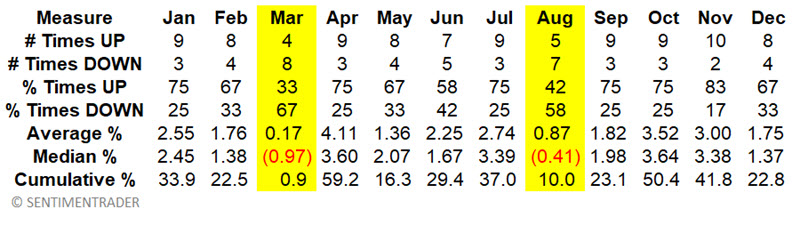
The table below displays performance data for each month only during Year 5 starting in 1905. Only two months (March and August) declined more often than they gained and showed a median loss. They are highlighted in yellow below.
From here, we designate:
- Favorable (Year 5) months as all months except March and August
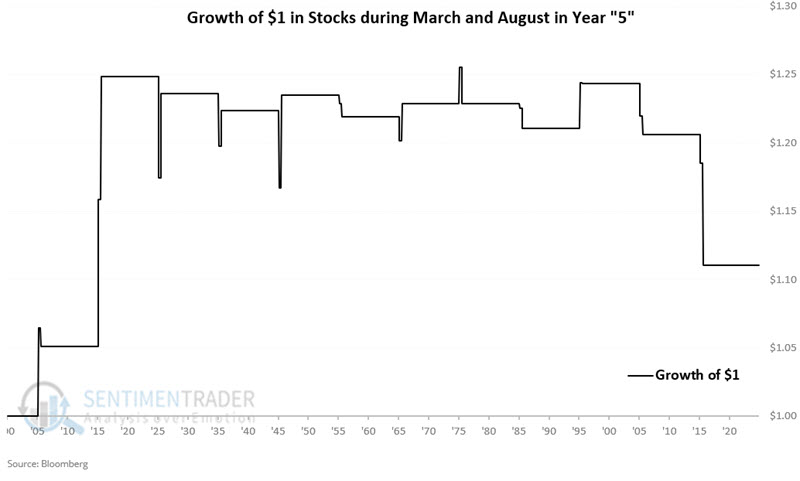
- Unfavorable (Year 5) months are March and August
A closer look at Favorable and Unfavorable Year 5 months
The chart below displays the hypothetical growth of $1 invested only during the ten favorable months of Year 5.
The chart below displays the hypothetical growth of $1 invested only during the unfavorable months of each Year 5.
Reviewing the results
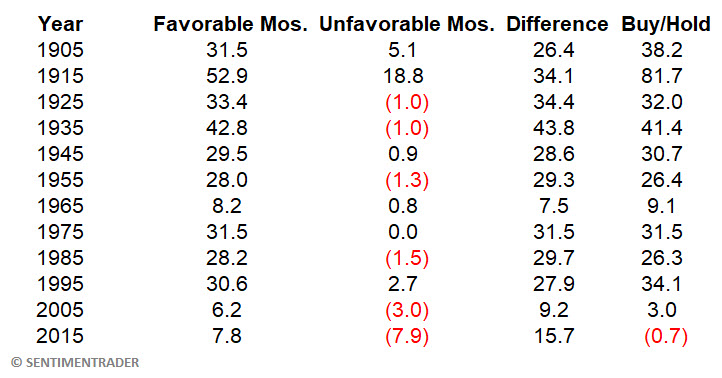
The table below displays Year 5 results broken down by Favorable month performance versus Unfavorable month performance.
- The first column lists the Year 5
- The second column displays the cumulative stock market gain/loss achieved only during the favorable months
- The third column displays the cumulative stock market gain/loss achieved only during the unfavorable months
- The fourth column subtracts unfavorable month performance from favorable month performance
- The fifth column displays results for simply buying and holding the index for the entire year
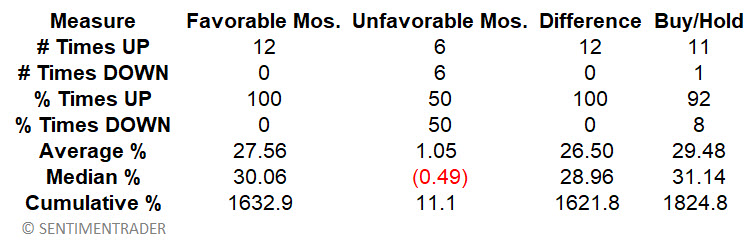
The table below summarizes stock market performance during Year 5.
What the research tells us…
That 2025 ends with a “5” is probably not in and of itself a good reason to buy and hold stocks. Still, there is no denying the tendency for stocks to perform well during this middle-of-the-decade period (including the three months before and after Year 5). After back-to-back years of +20%+ returns, the stock market is undoubtedly vulnerable to a meaningful correction. Still, given the history detailed above, as long as the major indexes hold above their long-term moving averages, investors may do well to continue to give the bullish case the benefit of the doubt.
Article courtesy of sentiment trader