
Moving averages are one of the most used tools in stock trading. Many traders actually use only this tool in their investment toolbox. Let’s see what they are.
What is a moving average?
In a time series, a moving average of period N at a certain time t, is the mean value of the N values before t (included). It’s defined for each time instant excluding the first N ones. In this particular case, we are talking about the Simple Moving Average (SMA) because every point of the average has the same weight. There are types of moving averages that weigh every point in a different way, giving more weight to the most recent data. It’s the case of the Exponential Moving Average (EMA) or the Linear Weighted Moving Average (LWMA).
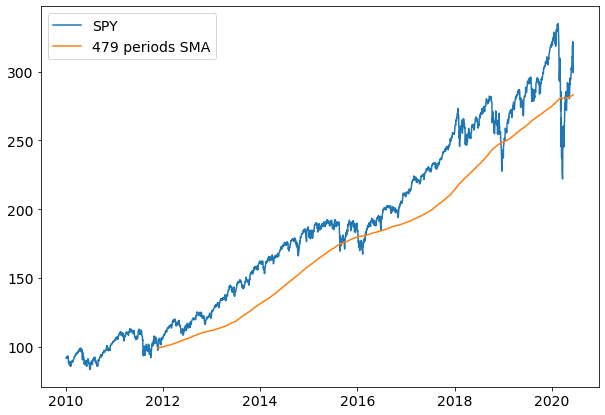
In trading, the number of previous time series observations the average is calculated from is called period. So, an SMA with period 20 indicates a moving average of the last 20 periods.

As you can see, SMA follows the time series and it’s useful to remove noise from the signal, keeping the relevant information about the trend.
Moving averages are often used in time series analysis, for example in ARIMA models and, generally speaking, when we want to compare a time series value to the average value in the past.
How are the moving averages used in stock trading?
Moving averages are often used to detect a trend. It’s very common to assume that if the stock price is above its moving average, it will likely continue rising in an uptrend.
The longer the period of an SMA, the longer the time horizon of the trend it spots.
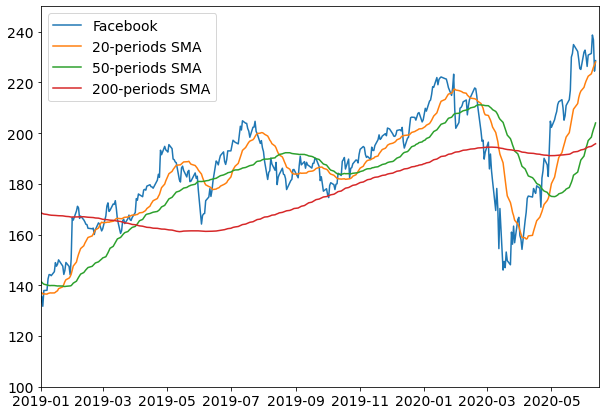
As you can see, short moving averages are useful to catch short-term movements, while the 200-period SMA is able to detect a long-term trend.
Generally speaking, the most used SMA periods in trading are:
- 20 for swing trading
- 50 for medium-term trading
- 200 for long-term trading
It’s a general rule of thumb among traders that if a stock price is above its 200-days moving average, the trend is bullish (i.e. the price rises). So they are often looking for stocks whose price is above the 200-periods SMA.
How can I choose the SMA period?
In order to find the best period of an SMA, we first need to know how long we are going to keep the stock in our portfolio. If we are swing traders, we may want to keep it for 5–10 business days. If we are position traders, maybe we must raise this threshold to 40–60 days. If we are portfolio traders and use moving averages as a technical filter in our stock screening plan, maybe we can focus on 200–300 days.
Choosing the investment period is a discretionary choice of the trader. Once we have determined it, we must try to set a suitable SMA period. We have seen 20, 50 and 200 periods, but are they always good? Well not really.
Markets change a lot during the time and they often make traders fine-tune their indicators and moving averages in order to follow volatility burst, black swans and so on. So there isn’t the right choice for the moving average period, you just need to determine your trading timeframe first, and then backtest which one fits the specific investment and importantly, the market condition, that you are in.
Get in touch with us at info@quantara.com.au to find out more.